
GUEST:
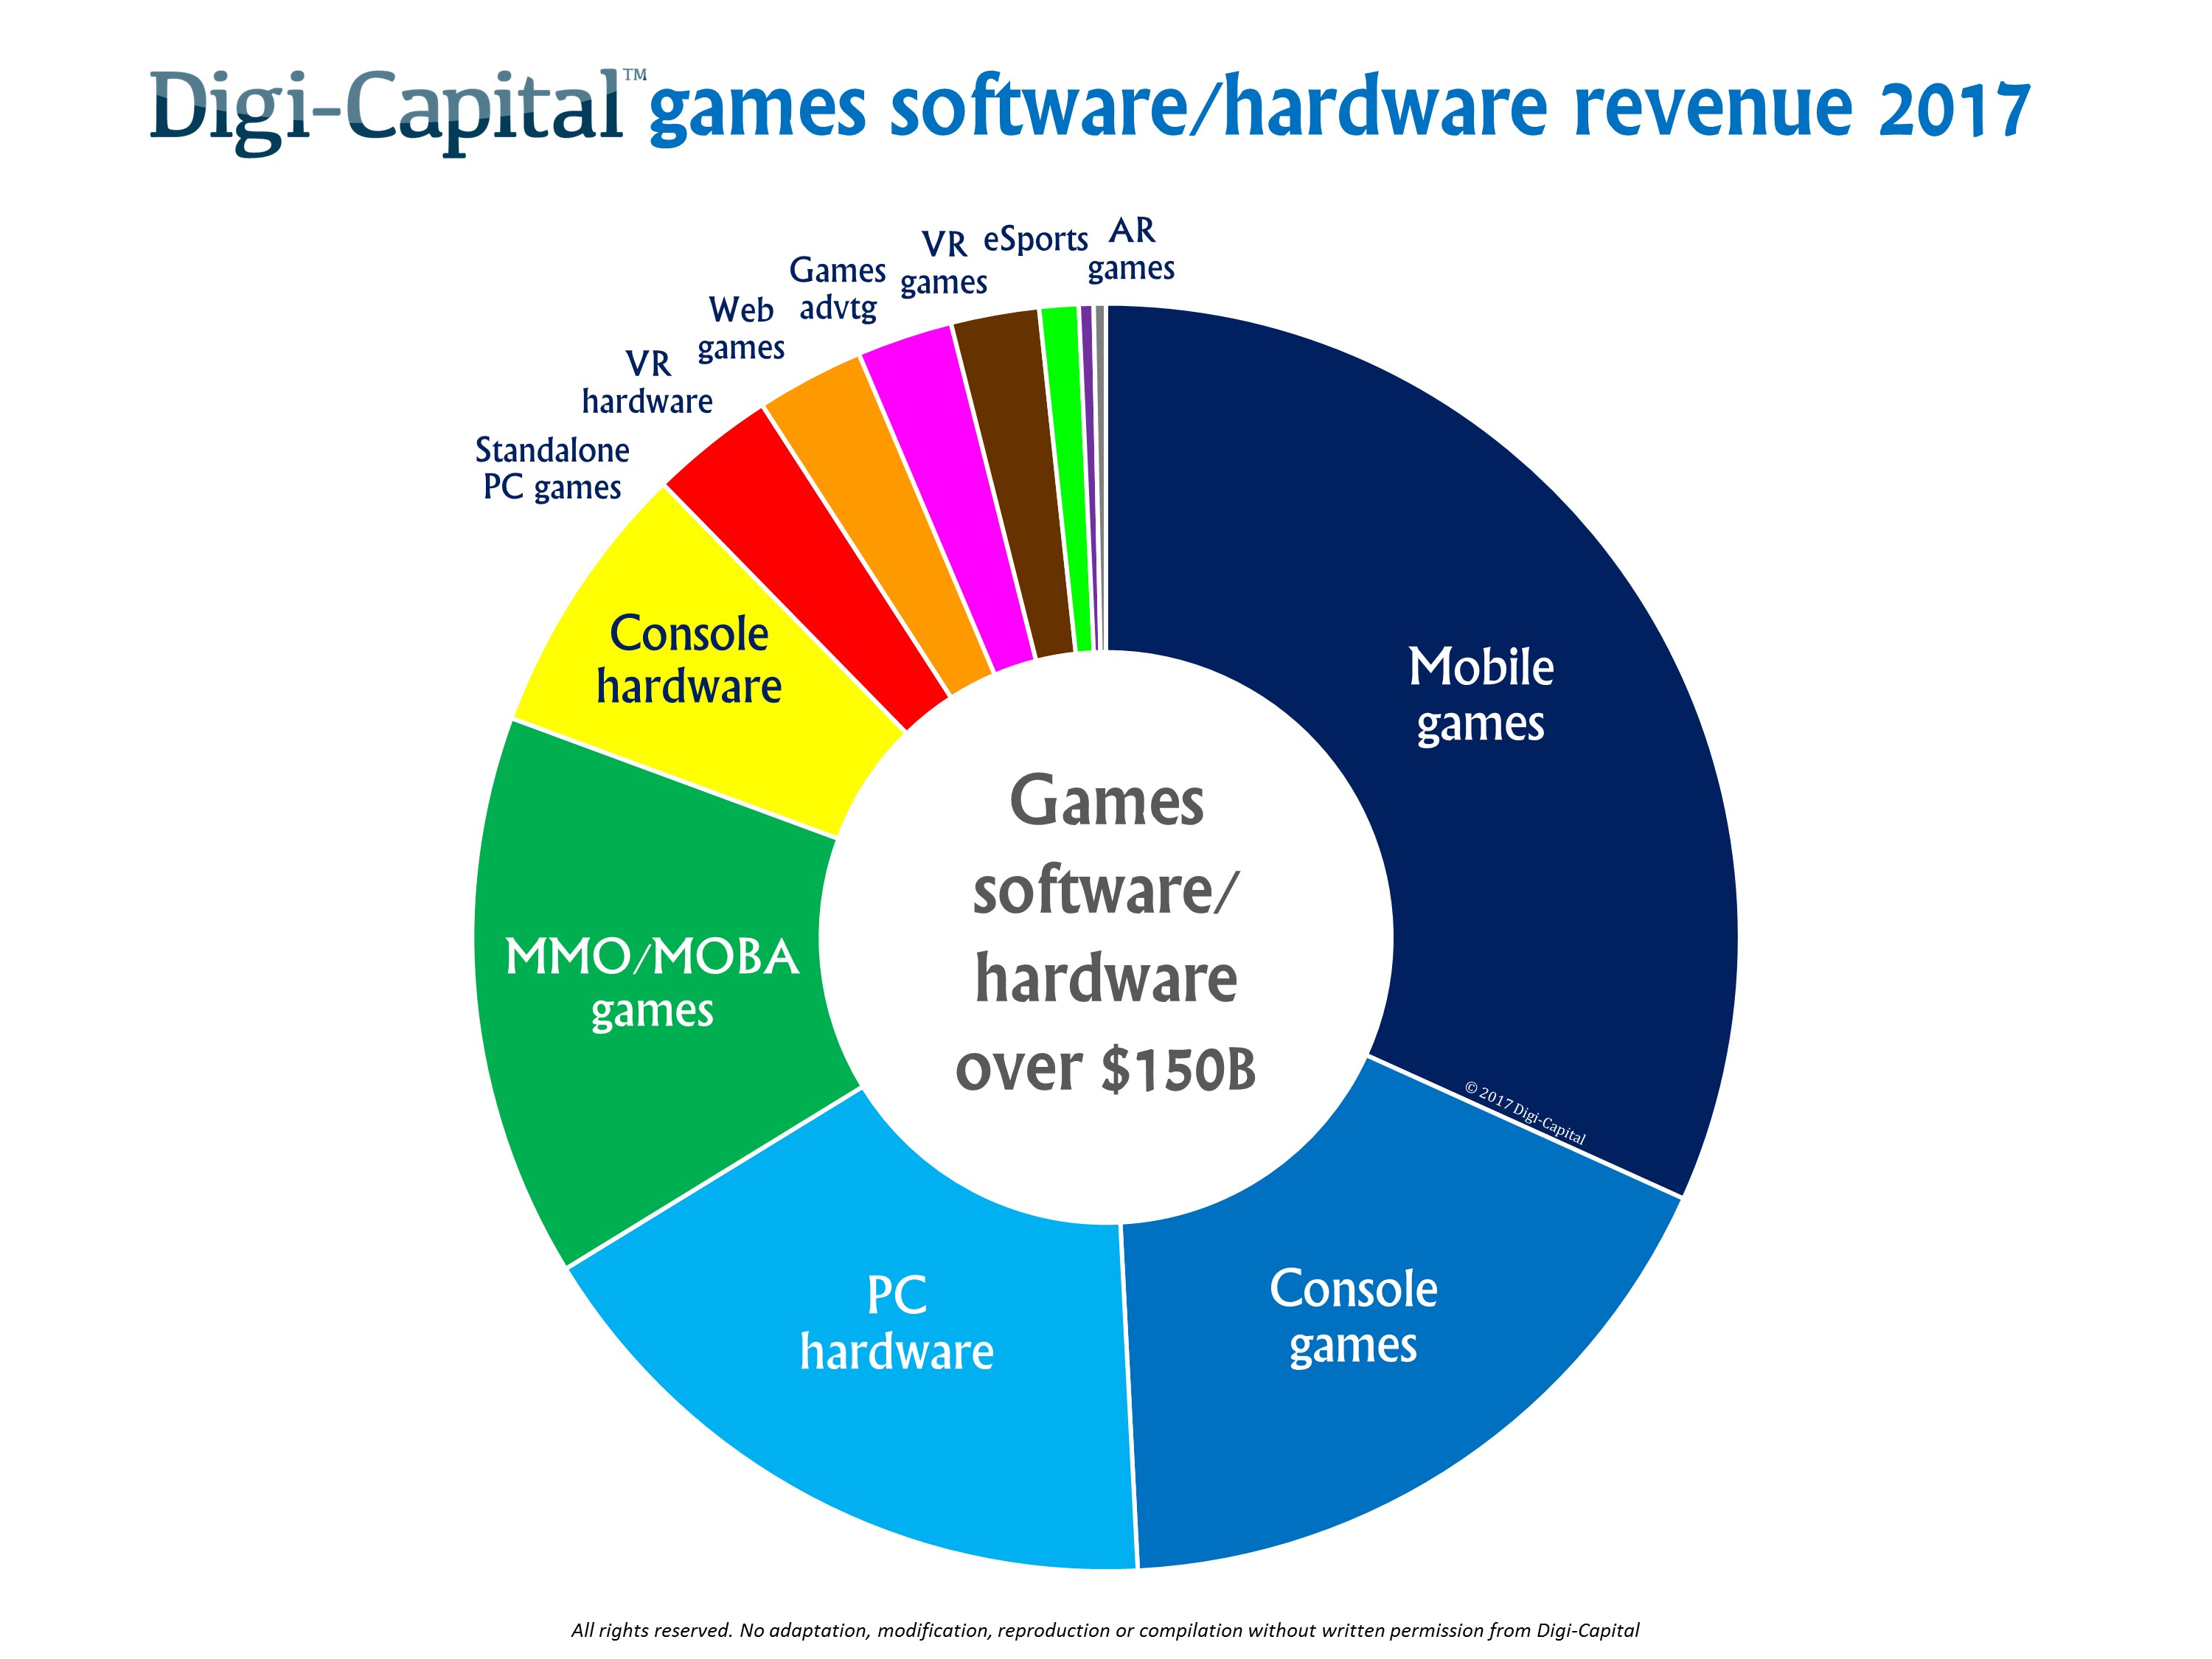
Games software and hardware combined are set to drive more than $150 billion revenue for the first time ever in 2017, with software taking around three-quarters and hardware around one-quarter of the total (Note: this is games software/hardware combined — non-hardware revenues could deliver over $110 billion globally this year). With a compound annual growth rate (CAGR) of 7.9 percent for the next 5 years, games software/hardware combined could top $200 billion by 2021 (as detailed in Digi-Capital’s new Games Report and Database Q3 2017).

But not everyone can win, as gaming has turned into a two speed market — giant sectors where giants rule, and small high-growth sectors where nimble indies can still make their mark.

Bigger than big, stronger than strong
Mobile games have grown like a weed since the launch of the iPhone, and the sector could top $50 billion revenue for the first time in 2017. Yet despite this out-performance, mobile games growth could slow to 14.5 percent CAGR to reach over $80 billion by 2021 (gross apps revenue across iOS, Google Play and all the Chinese app stores). That’s more revenue than the entire games market when we first covered it back in 2010 (coincidentally, it’s when we first forecast mobile games’ coming dominance, which folks thought outrageous back then).
Console games and MMO/MOBA games should each deliver less revenue individually than mobile this year, and with slowing growth could each individually drive around $30 billion revenue in five years’ time. This could make mobile games bigger than console games and MMO/MOBA games combined by then. The remaining big sectors of PC hardware and console hardware are broadly ex-growth (although Nintendo Switch has given console hardware a big bump this year and might help longer term), but could still drive well over $30 billion combined revenue by 2021.
Small but perfectly formed
At the other end of the scale is the land of the indies, where there’s room for them to breath. There isn’t enough money yet for the big boys, and this is a little like early mobile games.
VR hardware (headsets, peripherals and PCs/GPUs) could deliver in the low single digit billions-range this year, and drive over $7 billion revenue by 2021. But VR hardware is dominated by giants like Facebook and Samsung already, so solutions for specific technical problems are probably best for startups in this sector.
AR games software – particularly mobile AR games – had its first hit with Pokémon Go (even if industry insiders don’t like to call it AR). If mobile AR goes mass market in the next 12 months (helped by Facebook, Apple, Google and others), AR games software could drive almost $7 billion revenue in 5 years’ time – more than VR games.
Pokémon Go might have made more money than all VR games combined last year, but VR games software still has a lot of runway. With high growth rates, VR games software could top $6 billion by 2021.
Esports is the last of the high-growth sectors, but despite serious investment there are still questions over just how big it could become in revenue terms.
China, Japan and South Korea take $4 of every $10 in games this year
Combining the 50 major countries in our forecasts into regions gives a pretty consistent picture. Led by China, Asia has dominated games revenue for the last few years (which we also forecast for the first time in 2010 to much bemusement), and that dominance looks set to continue. This year China, Japan, and South Korea alone could deliver $4 of every $10 spent on games globally, and together with the rest of Asia-Pacific, it could see just under half of all games revenue globally. By comparison, the North American market could take around a quarter of games revenue and Western Europe a fifth. In some of the hottest growth sectors such as VR games, AR games, and esports, Asia has changed from the outdated view of it being an importer of Western approaches to becoming a true innovator.

Follow the money
The last year has seen a resurgence in games investment, with over $2.8 billion invested globally in the last 12 months to Q2 2017 for a new record. The previous high water mark for games investment was $2.4 billion for full-year 2014. On top of all that investment, Netmarble Games reopened the games IPO market by raising a stonking $2.3 billion in its IPO at over $11 billion market cap. Unsurprisingly, investment has been pouring into the highest growth sectors from our forecasts, with AR/VR and games tech/services each taking around one third, and mobile games around a quarter of all investment dollars. Similarly the money has been gratefully received by Chinese, American and (in the case of Netmarble) South Korean companies.With the industry hitting high scores across all the numbers that matter, now’s the time to tell your parents that working in games has become the sensible career option.
.

(You can read more in Digi-Capital’s new Games Report and Database Q3 2017, including industry dynamics, sector analysis, 12 sector and 50 country/region market revenue forecasts, valuation comparables and returns, investment, M&A and IPO analysis, as well as bundled database with all revenue forecasts to 2021, over 1,900 investment/M&A transactions, and detailed valuation comparables from 51 publicly listed games companies)
x
Thanks for your interest in the PC Gaming channel
Select the products you would like to subscribe to:
Country required
*By checking this box, you are confirming you are an adult 18 years or older and you agree to Intel contacting you with marketing-related emails or by telephone. You may unsubscribe at any time. Intel’s web sites and communications are subject to our Privacy Notice and Terms of Use.
Source: Games software/hardware revenue to top $150 billion in 2017