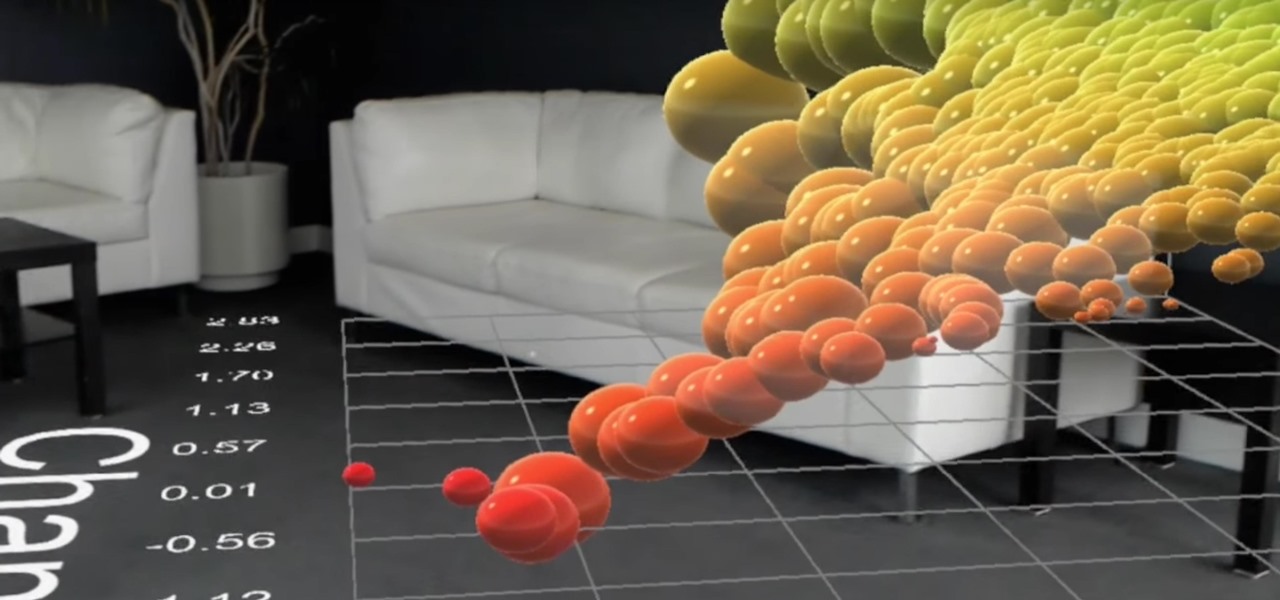

HoloLens developer Michael Peters of In-Vizible has released quite a few videos since receiving his HoloLens last year. Many of his experiments are odd and funny, but some include serious potential approaches to data visualization. In the videos embedded below, you’ll specifically see stock market information beautifully rendered in different ways to help understand the data.
Video: .
In Peters’ blog, he lists the various modes seen in the video above (as well as in the ones below) as the Këpler, Grid Array, 3D Scatterplot, and Tubes views.
Këpler view appears to be small planets with partial… more
Source: Experiments in Stock Market 3D Data Visualization on the HoloLens